Use the graph view
Who can use this feature?
🔐 Available to anyone.
⭐️ Available on all plans.
The graph view provides a bird's-eye view of your entire workspace, allowing you to quickly grasp its structure.
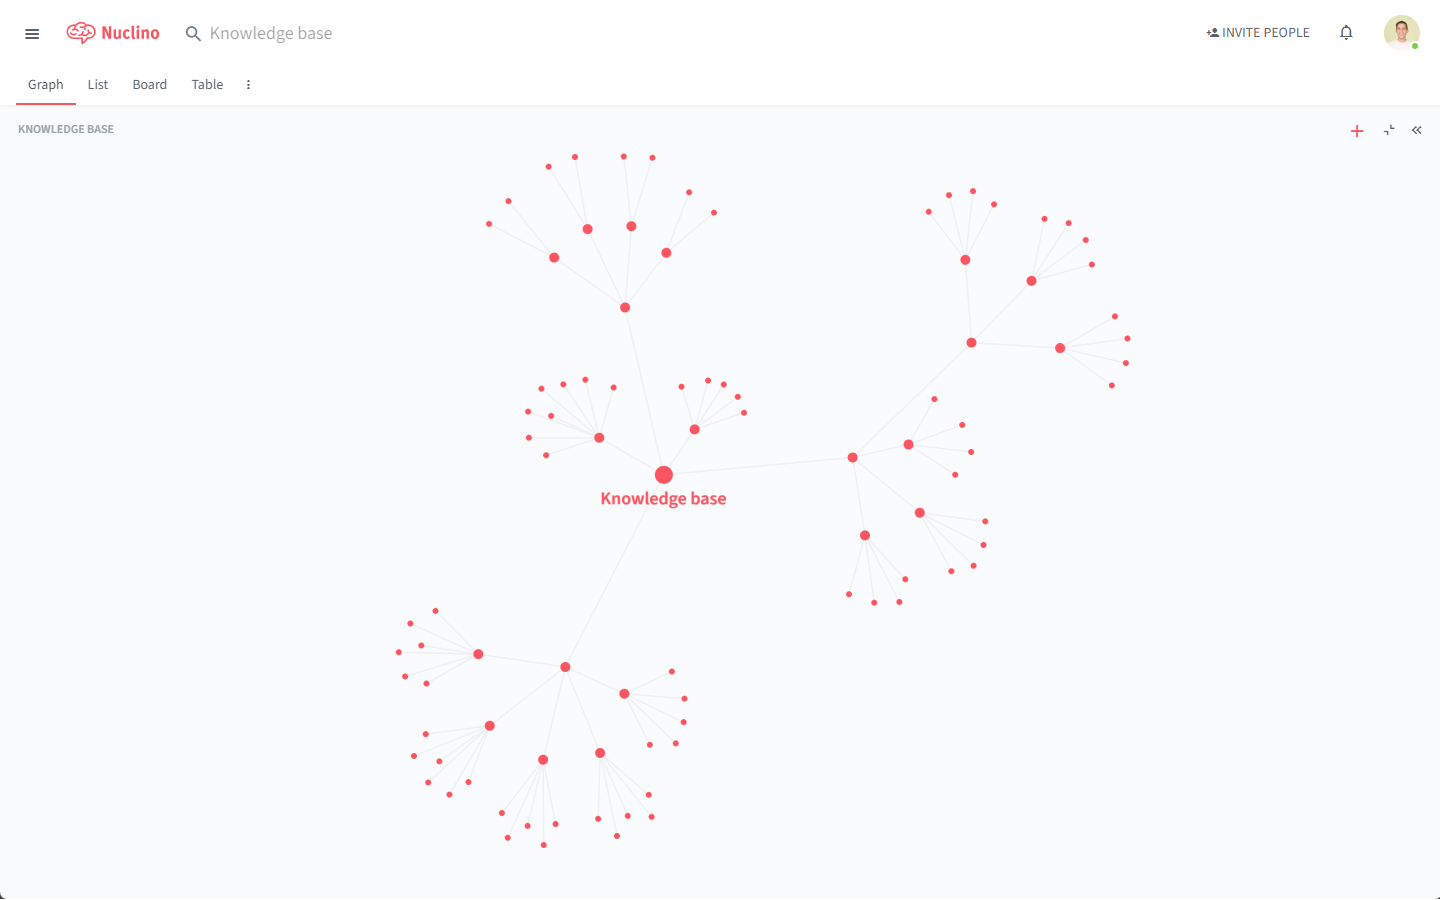
Each dot in the graph represents an item or a collection. Collections can contain an infinite number of nested sub-collections, allowing you to create a deep structure.
When you move your mouse over different dots, the graph will change color to highlight them.
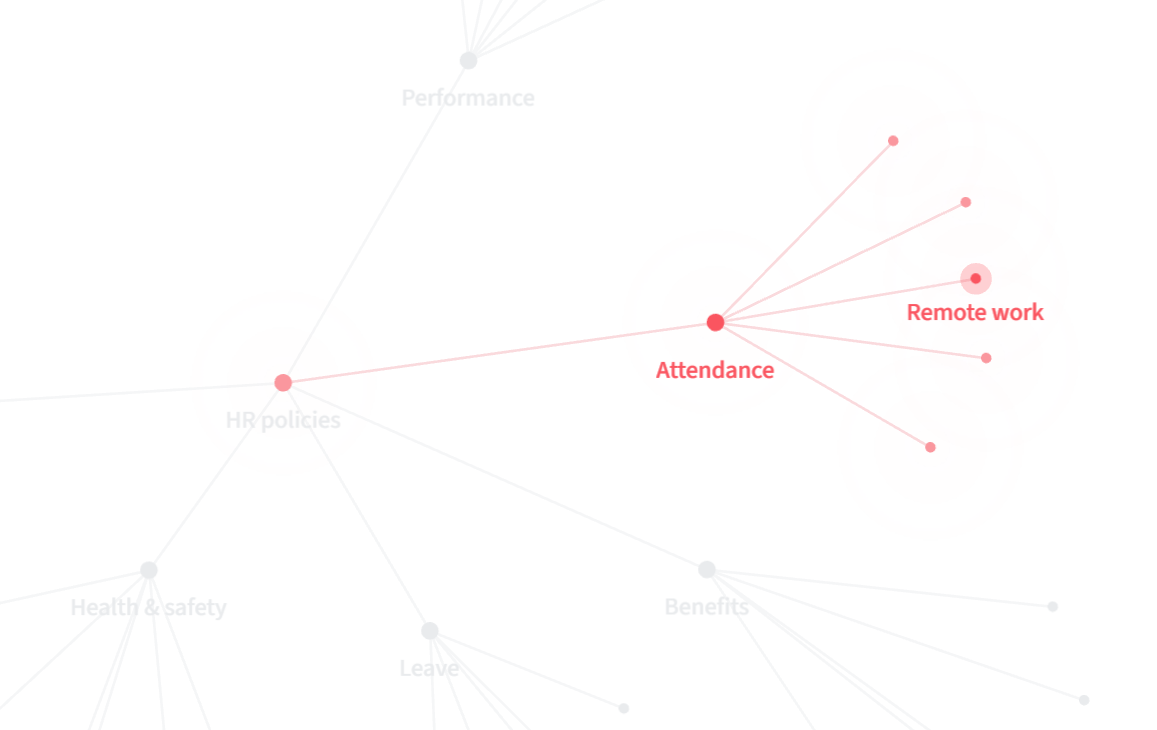
The graph view adapts based on your zoom level. When zoomed out, the collection and item titles are hidden to provide a clean, uncluttered view. As you zoom in, the titles appear, offering more detailed information.
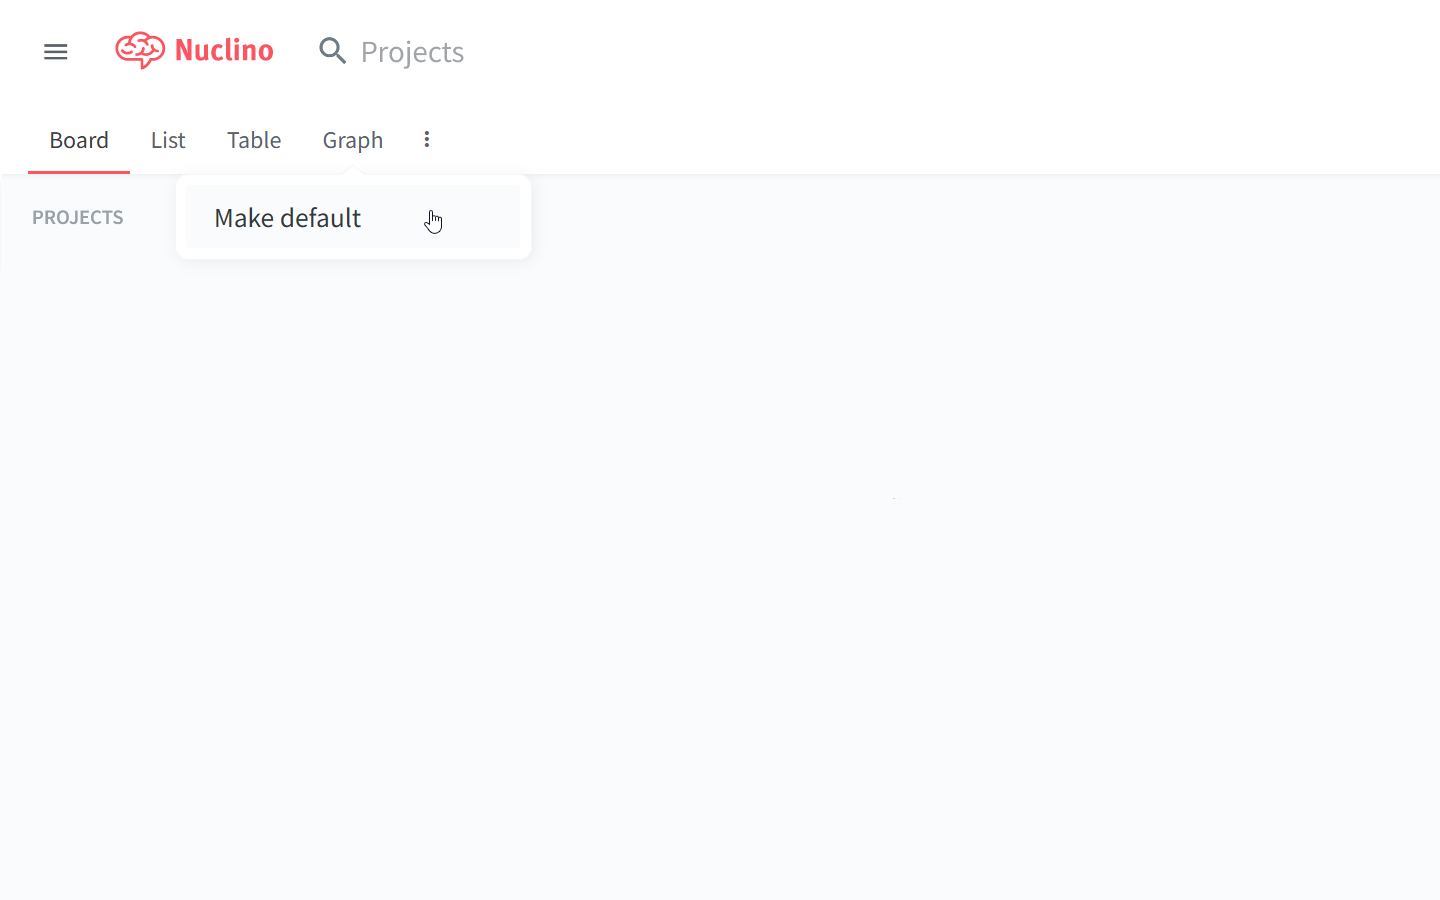
Make graph the default view
Each workspace has a default view which opens automatically when you open the workspace. The default view applies to all members of the workspace.
To make graph the default view, right-click the Graph view tab and select Make default.